Hate Crimes in America: The Data Behind the Pattern
The FBI reports around 11000 hate crimes per year. The actual count is closer to 265000. Black Americans are the most targeted group every year since 1992.

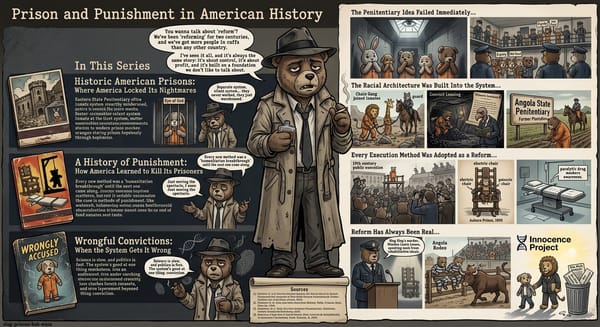
Hate Crimes in America: The Data Behind the Pattern
Hate crimes against Black Americans are the most frequently documented category of racially motivated crime in every year of federal reporting since 1992 — and the official numbers capture a fraction of what actually happens. The FBI’s Uniform Crime Reporting program documented 11,634 hate crime incidents in 2022, of which 64.3 percent were motivated by race, ethnicity, or ancestry, and of those, 52.2 percent targeted Black or African American victims. The Bureau of Justice Statistics’ National Crime Victimization Survey, which asks victims directly, estimated approximately 265,000 hate crime victimizations per year in 2020. The gap between those two figures is a policy failure, not a measurement discrepancy.^1^
Part of Modern Racial Violence — ← Back to series hub
Why the FBI’s Hate Crime Data Understates Reality by a Factor of Thirty
The FBI’s hate crime statistics depend on voluntary reporting by law enforcement agencies. In 2019, approximately 85 percent of agencies that participated in UCR reported zero hate crimes — not because their jurisdictions had no hate crimes, but because those agencies lacked the processes, will, or resources to identify, classify, and report them. The NCVS estimated approximately 265,000 hate crime victimizations per year in 2020, compared to the FBI’s reported 8,052 incidents.^2^
The gap matters because the FBI data is what drives policy, resource allocation, and public understanding. If the data says there are 7,000 hate crimes per year, agencies plan accordingly. If the actual number is closer to 250,000, the policy response is calibrated to less than 3 percent of the actual problem.
What Thirty Years of FBI Data Actually Shows
Within the FBI’s data — which understates the actual rate but correctly identifies the directional patterns — several things are consistent across the thirty-year history of reporting.
Black Americans are the most targeted racial group every year, typically at rates two to three times their share of the national population. In 2020 and 2021, during Black Lives Matter protests and a 67 percent increase in anti-Black hate crimes, the disparity was even more pronounced.^3^
Anti-Black hate crimes spike in response to specific political and social events. The FBI documented significant spikes in 2008 after Barack Obama’s election, in 2015–2016 during the Dylann Roof trial and the Trump campaign, and in 2020 during the George Floyd protests. These spikes are documented responses to perceived challenges to white racial status.
Hate crimes against Black people are more likely to involve violence than hate crimes against other groups, and have involved weapons — particularly firearms — at significant rates.
Black Institutions Are Disproportionately Targeted
Black churches have been the site of consistent attacks throughout American history: the 16th Street Baptist Church bombing in Birmingham in 1963, dozens of Black church burnings across the South in 1995 and 1996 significant enough to trigger a federal task force, and continued attacks including the 2015 Charleston shooting and church burnings that followed it.
The National Church Arson Task Force, convened by President Clinton in 1996, documented 496 church fires between January 1995 and September 1998. Federal investigations found racial motivation in approximately 162 of those fires across thirty states.^4^
Black neighborhoods experience hate crimes including property destruction, graffiti, cross burnings, and intimidation at rates that community organizations track but that the official data substantially misses, because these incidents are often not reported to police or not classified as hate crimes when they are.
The 2019–2023 Period: Elevated and Sustained
Between 2019 and 2023, the FBI documented a significant overall increase in hate crimes and a sustained elevation in anti-Black hate crimes specifically. The 2020 spike — a 40 percent increase over 2019 in anti-Black hate crimes — was followed by continued elevated rates in 2021, 2022, and 2023.
The Anti-Defamation League’s H.E.A.T. Map documented 7,759 incidents in 2022 — a 7 percent increase from 2021. White supremacist propaganda distribution increased 38 percent in 2022, concentrated in Florida (28 percent of all incidents), California, and Texas.^5^
The connection between propaganda distribution and subsequent violence is not speculative. The FBI has documented radicalization pipelines in the cases of the Charleston shooting, the 2018 Tree of Life synagogue shooting, the 2019 El Paso Walmart shooting, and numerous smaller-scale incidents. Dylann Roof’s path is the documented example, but the pipeline itself is a documented feature of the white supremacist resurgence.
What Under-Reporting Means for Policy
The pattern is visible even through the distorted lens of the official data. Adjusted for under-reporting, what you’re looking at is not a crime category that ebbs and flows with social trends but a persistent, high-rate form of targeted violence against Black Americans that has continued across every decade of modern American history.
Federal hate crime law — the Matthew Shepard and James Byrd Jr. Hate Crimes Prevention Act, signed in 2009 — provides federal jurisdiction over bias-motivated crimes. It has not produced prosecutions at rates proportional to the actual hate crime rate, because it depends on local agencies identifying, reporting, and referring cases, and local agencies do not reliably do that.
James Byrd Jr. was killed in Jasper, Texas, on June 7, 1998 — dragged behind a pickup truck by three white men for three miles, his body dumped in front of a Black church. He was 49 years old. The law named for him was signed eleven years after his death. The FBI data from 1998, generated by voluntary agency reporting with no enforcement mechanism, documented 7,755 hate crime incidents nationally — a fraction of what happened.
─────────
Sources:
- Federal Bureau of Investigation. Hate Crime Statistics, 2022. U.S. Department of Justice, 2023.
- Bureau of Justice Statistics. Hate Crime Victimization, 2004–2020. U.S. Department of Justice, 2021.
- Southern Poverty Law Center. The Year in Hate and Extremism 2022. SPLC, 2023.
- National Church Arson Task Force. Third Year Report for the President. U.S. Department of Justice, 1998.
- Anti-Defamation League. ADL H.E.A.T. Map: Hate, Extremism, Antisemitism, Terrorism — 2022 Year in Review. ADL, 2023.