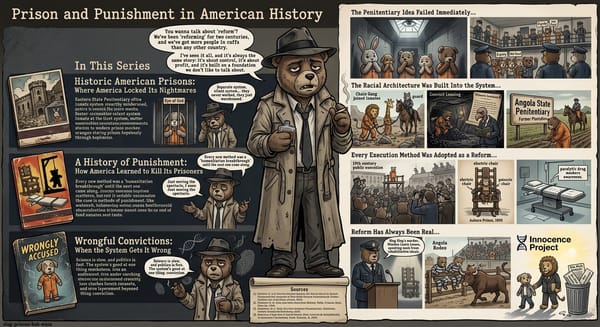
Mass Incarceration: How the Drug War Built the Prison System
The U.S. prison population grew from 200000 to 2.3 million between 1972 and 2008 — a 1000 percent increase. Drug offenses drove a twelve-fold share of that growth while Black incarceration hit six times the white rate.
Mass Incarceration: How the Drug War Built the Prison System
In 1972, the United States incarcerated approximately 200,000 people in state and federal prisons. By 2008, that number had reached 2.3 million — an increase of more than 1,000 percent in 36 years.^1^ No other country in the world, democratic or authoritarian, has ever incarcerated its population at the rate the United States achieved and maintained through the late twentieth and early twenty-first centuries. At its peak, the U.S. incarceration rate was five to seven times that of comparable Western democracies. The drug war did not cause all of this. But it built the architecture.
Part of The War on Drugs — ← Back to series hub
What the Prison System Looked Like Before the War on Drugs
Understanding what mass incarceration is requires understanding what came before it. American incarceration rates were relatively stable from the 1920s through the early 1970s, hovering around 100 per 100,000 residents — roughly consistent with the rates maintained by other Western democracies. The federal prison system was small. State prisons held more people, but the population was bounded by sentencing norms that granted judges broad discretion and assumed that rehabilitation was a legitimate goal.
The 1971 report of the National Advisory Commission on Criminal Justice Standards and Goals actually recommended a ten-year moratorium on new prison construction, arguing that prisons were failing at rehabilitation and that alternatives should be developed. That recommendation was immediately overtaken by events: the Rockefeller Drug Laws passed in New York in 1973, the Comprehensive Drug Abuse Prevention and Control Act began generating federal prosecutions, and the political wind shifted decisively toward incarceration as the dominant response to crime.
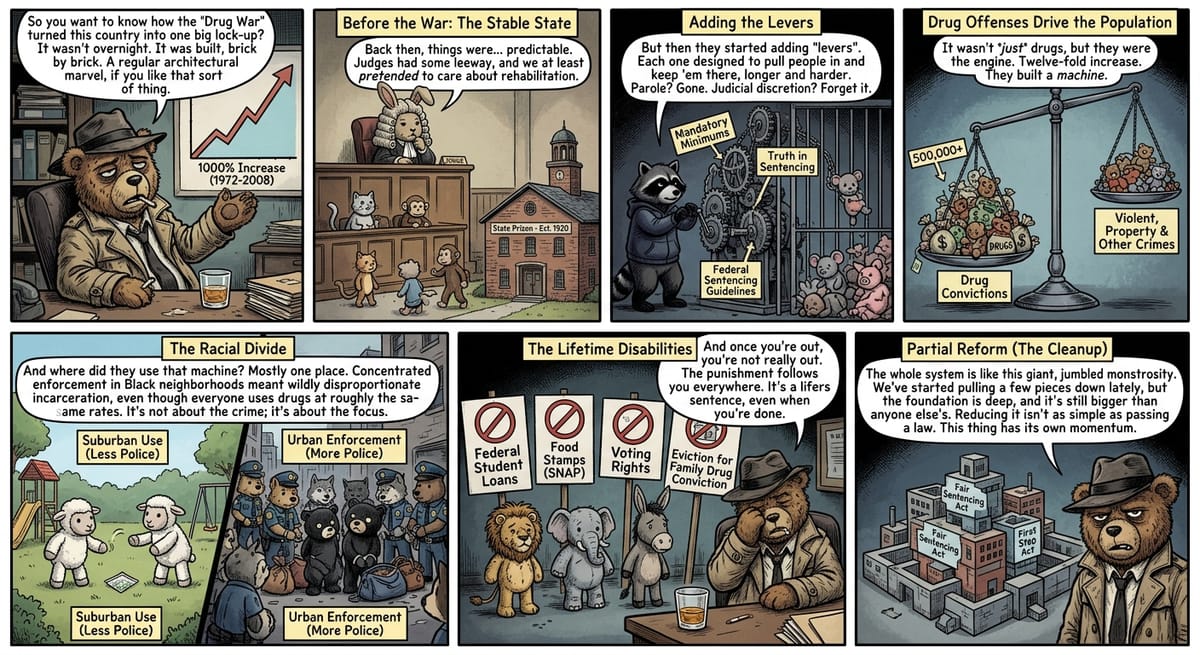
How Each Sentencing Law Added Another Lever
By the mid-1980s, the sentencing structures that would drive mass incarceration were in place. The Anti-Drug Abuse Act of 1986 created federal mandatory minimums. The Anti-Drug Abuse Act of 1988 added additional minimums and created new categories of drug conspiracy offense. The 1994 Violent Crime Control and Law Enforcement Act provided $9.7 billion for state prison construction, conditioned on states adopting “truth in sentencing” laws requiring violent offenders to serve at least 85 percent of their sentences — a provision that slowed prison release rates dramatically.^2^
The Sentencing Reform Act of 1984 had already curtailed federal parole, meaning federal prisoners served more of their sentences. The federal sentencing guidelines, implemented in 1987, reduced judicial discretion and moved sentences upward for drug and other offenses. State legislatures, watching the federal pattern and responding to the same political pressures, adopted similar structures. The result was a system that admitted more people through mandatory minimum thresholds, held them longer through truth-in-sentencing requirements, and had fewer release valves through curtailed parole.
Drug Offenses Drove the Prison Population Twelve-Fold
Not all of mass incarceration is drug war. Violent crime prosecutions, property crime prosecutions, and immigration enforcement all contributed to the prison population growth of the 1980s through 2000s. But drug offenses account for a disproportionate share of the increase.
Between 1980 and 2008, the number of people incarcerated for drug offenses in state and federal prisons increased from approximately 41,000 to more than 500,000 — a twelve-fold increase, while the overall prison population grew roughly six-fold.^1^ Drug offenses went from representing a modest fraction of the prison population to representing approximately 20 percent of state prisoners and more than 50 percent of federal prisoners by the mid-2000s. The Sentencing Project, in its comprehensive analysis of state and federal sentencing data, found that drug offenses were the single largest driver of prison population growth between 1985 and 2000.
Why Black Incarceration Rates Had No Precedent
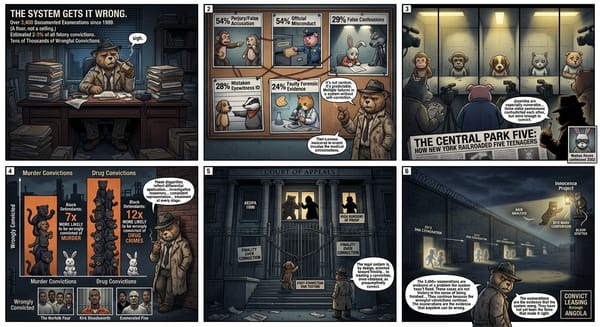
The racial composition of the prison population during the mass incarceration era was the most striking feature of the system. Black Americans, who represent approximately 13 percent of the U.S. population, accounted for approximately 38 percent of the state prison population by 2010.^3^ The Black incarceration rate was six times the white incarceration rate. In some states — Illinois, Iowa, Wisconsin, New Jersey — the disparity exceeded ten to one.
These numbers were not produced by equivalent differences in crime rates. The National Survey on Drug Use and Health, conducted annually by SAMHSA, has consistently found that white and Black Americans use illegal drugs at roughly equivalent rates. The difference in incarceration rates for drug offenses reflects enforcement patterns: where police look, who prosecutors charge, what sentences judges and mandatory minimums impose. Drug enforcement was concentrated in cities, in Black neighborhoods, and on street-level transactions that were visible — not in the suburban homes, college campuses, and corporate offices where equivalent drug activity occurred with less police presence.
Michelle Alexander, in The New Jim Crow (2010), argued that mass incarceration functioned as a new racial caste system, stripping people with felony convictions of the rights — to vote, to access public housing and federal benefits, to serve on juries — that formal desegregation had delivered. The argument generated significant debate about causation and intent, but the factual baseline it rested on — that Black men were incarcerated at rates that had no precedent in American history and bore no relationship to equivalent differences in criminal behavior — was not seriously contested.
The Legal Disabilities That Outlast the Sentence
Prison is not the only consequence of a drug conviction. The collateral consequences — the legal disabilities that attach to a felony record — extend far beyond the sentence. Federal law, as of 1996, made people with drug convictions ineligible for federal student loans. The Personal Responsibility and Work Opportunity Reconciliation Act of 1996 imposed a lifetime ban on SNAP and Medicaid benefits for people convicted of drug felonies in states that had not opted out of it, meaning that a person released from prison after a drug conviction could be ineligible for food assistance.
Public housing law allowed and often required the eviction of entire families when any household member received a drug conviction. The Supreme Court upheld this “one strike” policy in HUD v. Rucker (2002). A son’s drug conviction could make an entire family homeless. By 2003, an estimated 5.3 million Americans had lost the right to vote due to felony disenfranchisement laws, according to The Sentencing Project — and because drug convictions were so heavily concentrated among Black men, disenfranchisement fell with particular force on the Black community: in seven states, more than 20 percent of Black men could not vote.^4^
What Partial Reform Has and Has Not Fixed
The U.S. prison population peaked in 2008 and has declined somewhat since, reaching approximately 1.9 million by 2020. The decline reflects several factors: criminal justice reform legislation at state and federal levels, a gradual recognition across both political parties that mass incarceration was expensive and not demonstrably reducing crime, and the specific provisions of laws like the Fair Sentencing Act of 2010 and the First Step Act of 2018.
But the decline has been modest relative to the scale of the buildup. The U.S. incarceration rate in 2020 remained more than double what it was in 1980 and remained higher than any other developed country. The people who were incarcerated during the mass incarceration era — who served their time and were released with felony records, stripped of benefits and voting rights, returning to communities that had been hollowed out in their absence — are still living with those consequences. Mass incarceration was built by accumulation — one sentencing law, one prison construction bill, one mandatory minimum threshold at a time. No single architect designed it. But it responded to political incentives that rewarded toughness, drew its racial character from a drug enforcement pattern that concentrated on Black communities, and built a physical, legal, and social infrastructure that became self-sustaining. The three-strikes laws added life sentences on top. Stop-and-frisk fed the pipeline from the street. Drug reform has reduced the intake but hasn’t changed the structure. Reducing it has proven far harder than building it.
─────────
Sources:
- Alexander, Michelle. The New Jim Crow: Mass Incarceration in the Age of Colorblindness. The New Press, 2010.
- Western, Bruce. Punishment and Inequality in America. Russell Sage Foundation, 2006.
- Mauer, Marc. Race to Incarcerate. The New Press, 1999.
- Bureau of Justice Statistics. Prisoners in 2010. U.S. Department of Justice, 2011.
- The Sentencing Project. Report of The Sentencing Project to the United Nations Human Rights Committee. The Sentencing Project, 2013.